LLM Inference on TPU v6e-4: Small Dense, Large MoE, and Large Dense Models
- EN
- ZH-CN
Table of Contents
#
Abstract
We benchmark LLM inference on one Google TPU v6e-4 host (four chips, one VM) with four chips in one VM. We use vLLM 0.20.0 with the tpu-inference backend and an fp8 KV cache.
We test three Qwen3 models:
| Model | Type | Params | Parallelism | Chips |
|---|---|---|---|---|
| Qwen3.5-4B | dense | 4B active | tp1 | 1 |
| Qwen3-30B-A3B | MoE | 30B total / 3B active | tp4 | 4 |
| Qwen3-32B | dense | 32B active | tp4 | 4 |
We measure three parts of inference: prefill, decode, and end-to-end online serving.
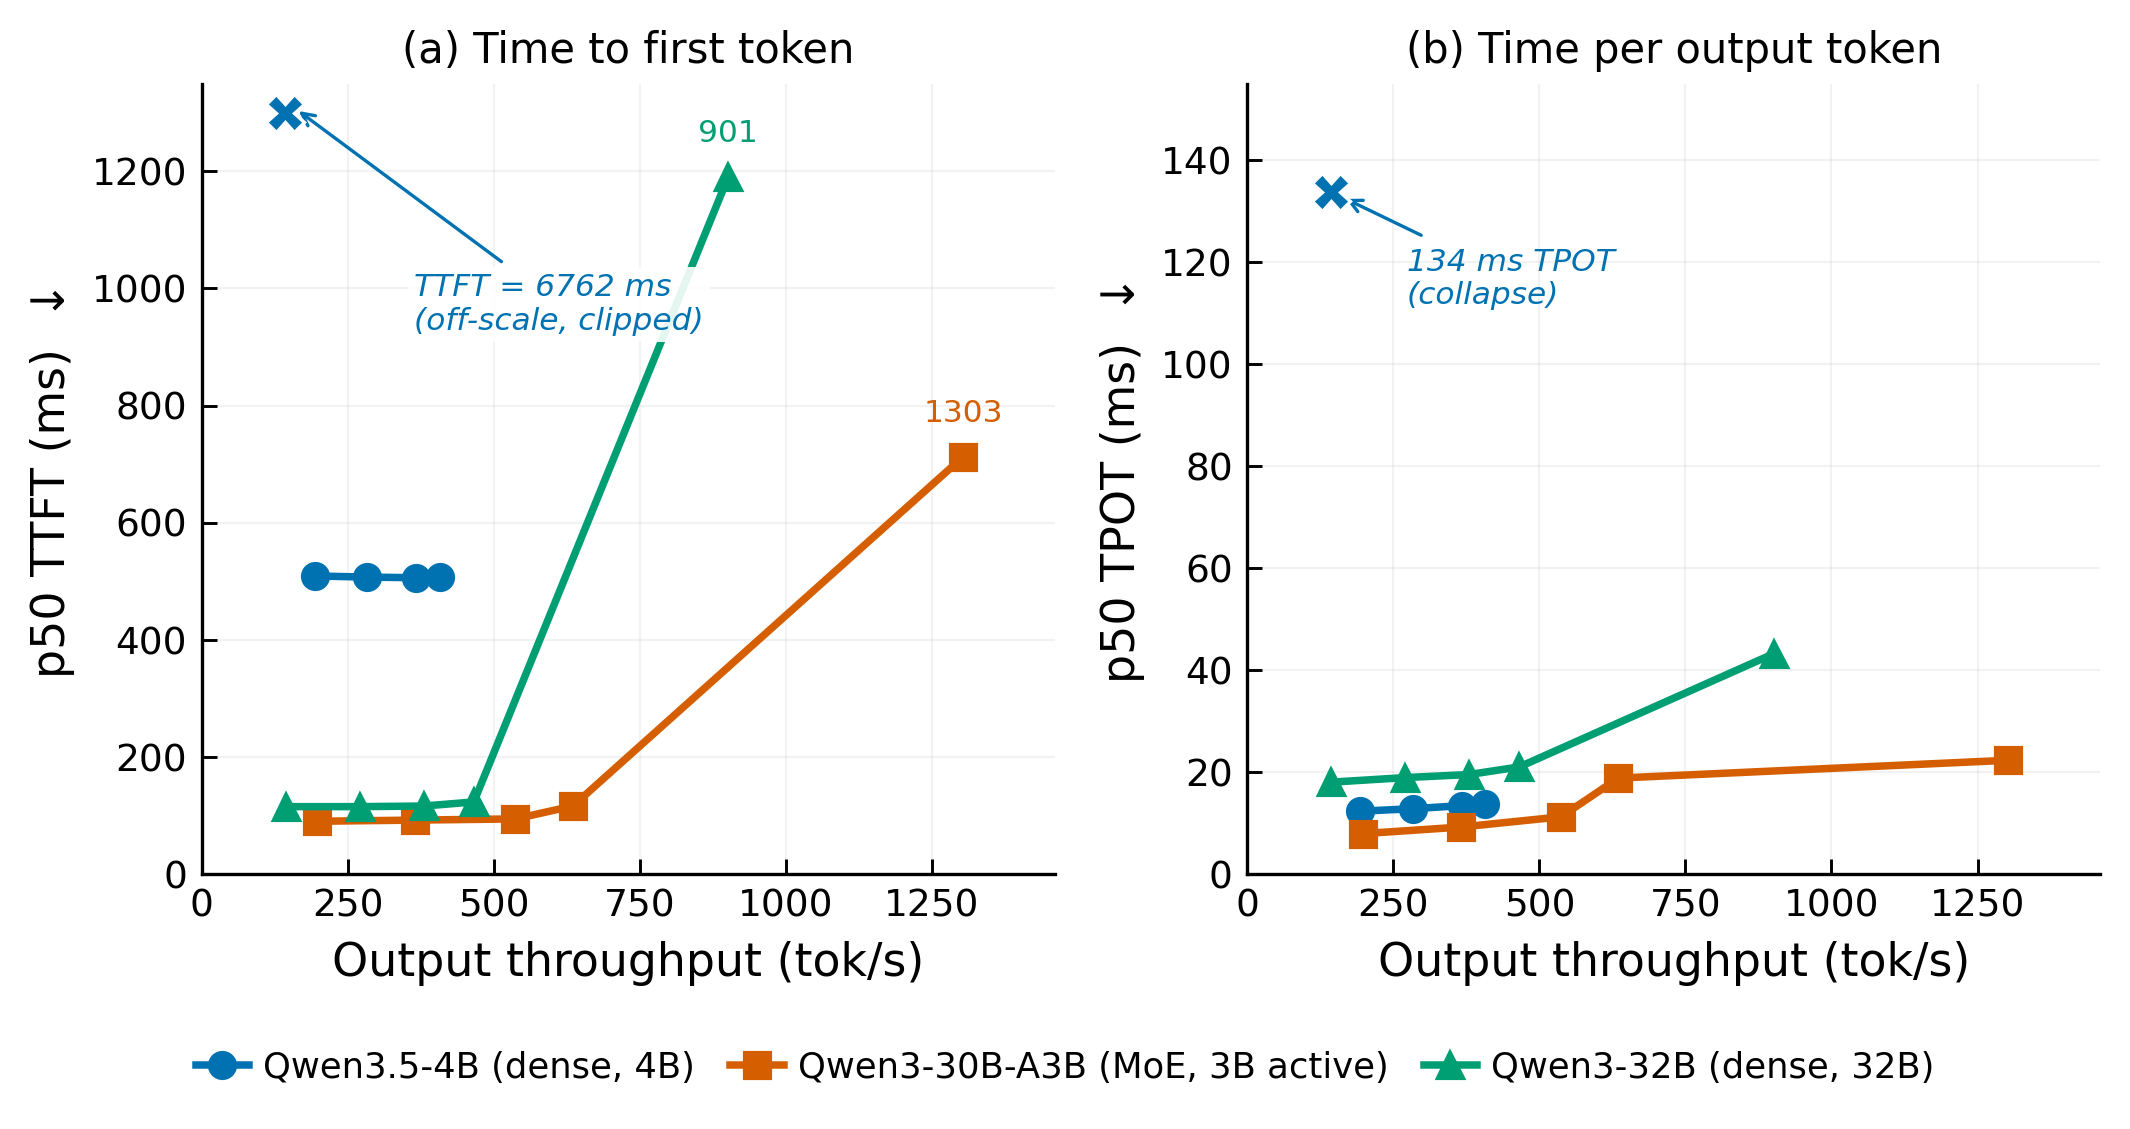
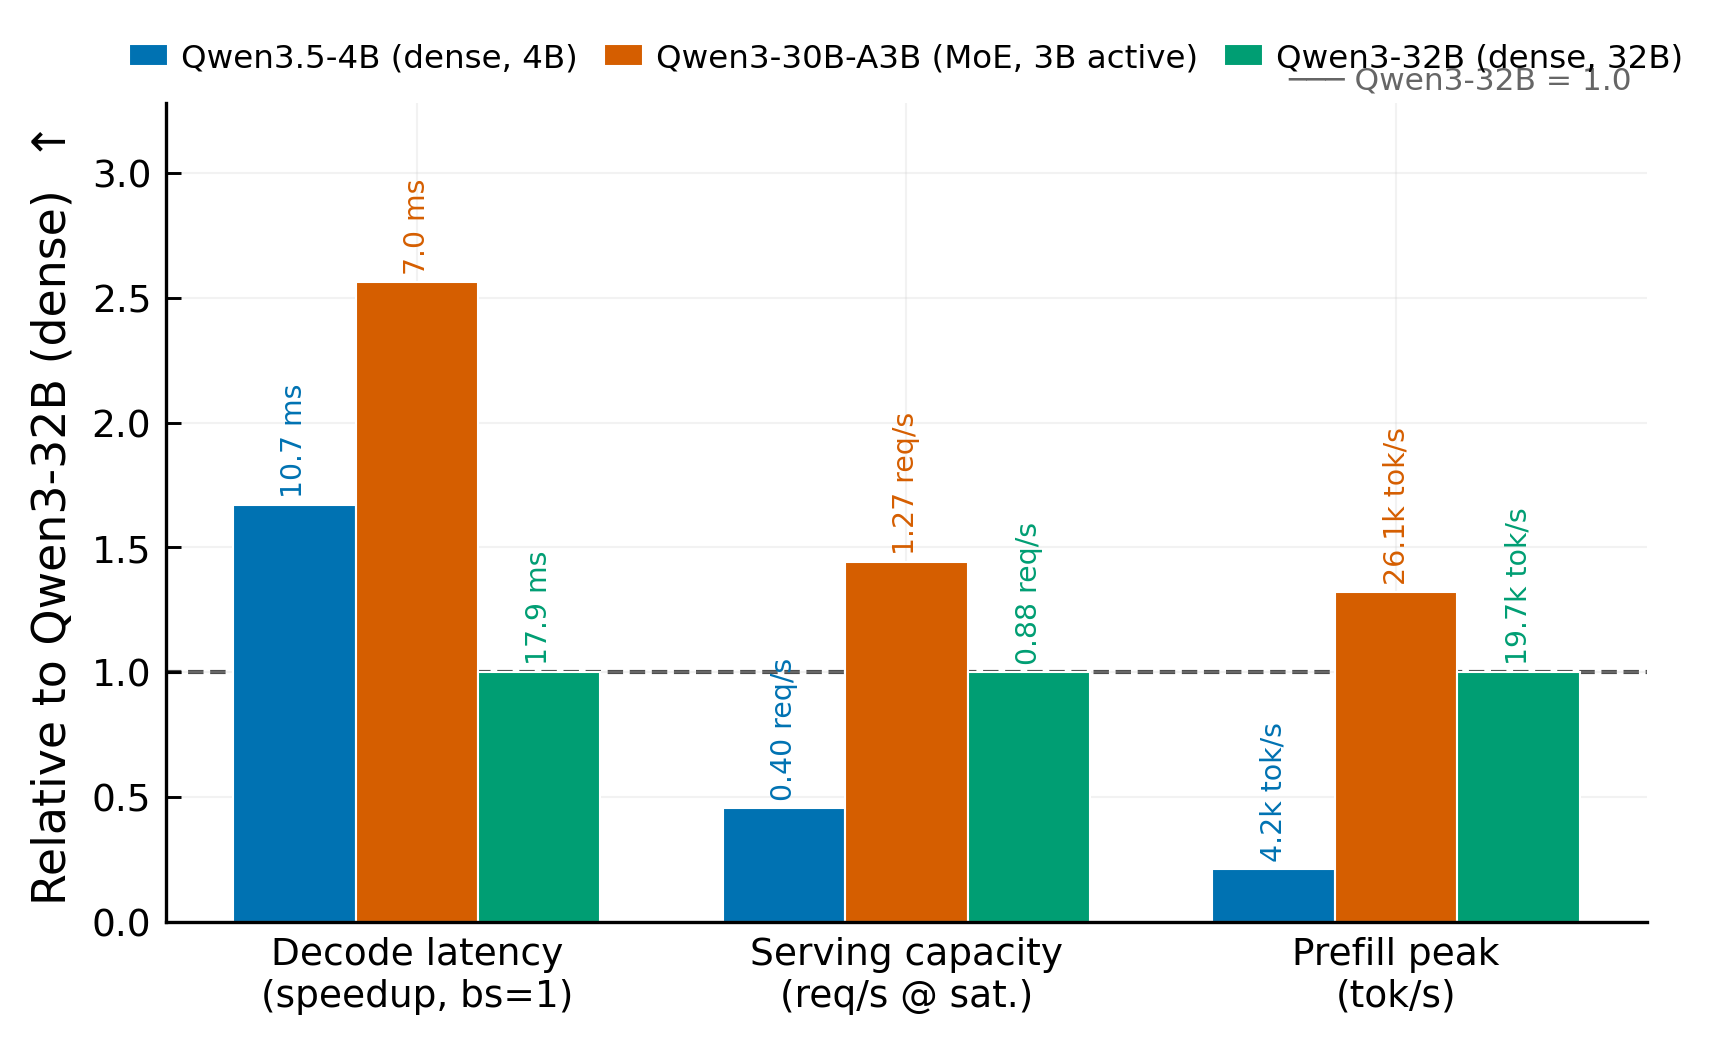
The MoE model is fastest in all three tests. It reaches 26,063 tok/s in prefill, compared with 19,714 tok/s for the dense 32B model. At batch size 1, its decode latency is 7.0 ms per token, compared with 17.9 ms for the dense 32B model. In online serving, it reaches 1.27 req/s and 1,303 output tok/s, compared with 0.88 req/s and 901 output tok/s for the dense 32B model.
The 4B model has good latency at low load, but it does not handle high concurrency well on one chip. Its stable serving capacity is about 0.45 req/s.
This is not a TPU-versus-GPU comparison. We did not run a GPU baseline. The goal is to report clear TPU v6e numbers using the same vLLM tools that users would run in practice.
#
1. Motivation
Public TPU data for LLM inference is limited. The only TPU submission Google has made to MLPerf Inference is SDXL image generation, not an LLM. The TPU LLM numbers is measured on Google’s JAX/JetStream stack rather than the vLLM path most practitioners deploy.
We measured the performance ourselves on one TPU v6e-4 host. The goal is to give simple, reproducible numbers for three common model types:
- a small dense model,
- a large MoE model,
- a large dense model.
All comparisons are between these three models on the same TPU host. We do not compare against GPUs, prices, or total cost.
#
2. Experimental Setup
All measurements use one TPU v6e-4 host with four chips in one VM. The 4B model uses one chip. The 30B-A3B and 32B models use all four chips. For per-chip numbers, we divide the four-chip throughput by four.
We use vLLM 0.20.0, JAX 0.10.0, libtpu 0.0.40, Python 3.11 with the tpu-inference backend. The KV cache uses fp8_e5m2 in all runs. We report exact versions because TPU performance can change quickly across releases.
| Model | Type | Total / active params | Parallelism | Chips | Config |
|---|---|---|---|---|---|
| Qwen3.5-4B | dense | 4B / 4B | tp1 | 1 | GDN, MBT2048 |
| Qwen3-30B-A3B | MoE | 30B / 3B | tp4 | 4 | GMU0.8, MBT8192 |
| Qwen3-32B | dense | 32B / 32B | tp4 | 4 | GMU0.8, MBT8192 |
The key comparison is between Qwen3-30B-A3B and Qwen3-32B. They have similar total size, but the MoE model only uses 3B parameters per token, while the dense 32B model uses all 32B.
We run three tests.
For prefill, we use concurrency 1 and output length 1. We vary context length over 512, 1024, 2048, 4096, and 8192 tokens. This measures how fast the model processes the input prompt.
For decode, we fix the output length at 128 tokens and vary batch size over 1, 4, 16, and 64. We mainly report context length 1024, with context length 4096 as a longer-KV case. This measures the cost of generating tokens after prefill.
For online serving, we use vllm bench serve against the OpenAI-compatible endpoint. Input and output lengths are both 1024 tokens. We increase the request rate until the server saturates.
Metrics:
- TTFT: time to first token. This mainly measures prefill.
- TPOT: time per output token. This mainly measures decode.
- E2E latency: full request time.
- Prefill throughput: context length divided by p50 TTFT.
- Decode throughput: batch size × 1000 divided by p50 TPOT.
- Output throughput: generated tokens per second.
- Request throughput: completed requests per second.
We report p50 unless stated otherwise.
#
3. Results
##
3.1 Prefill
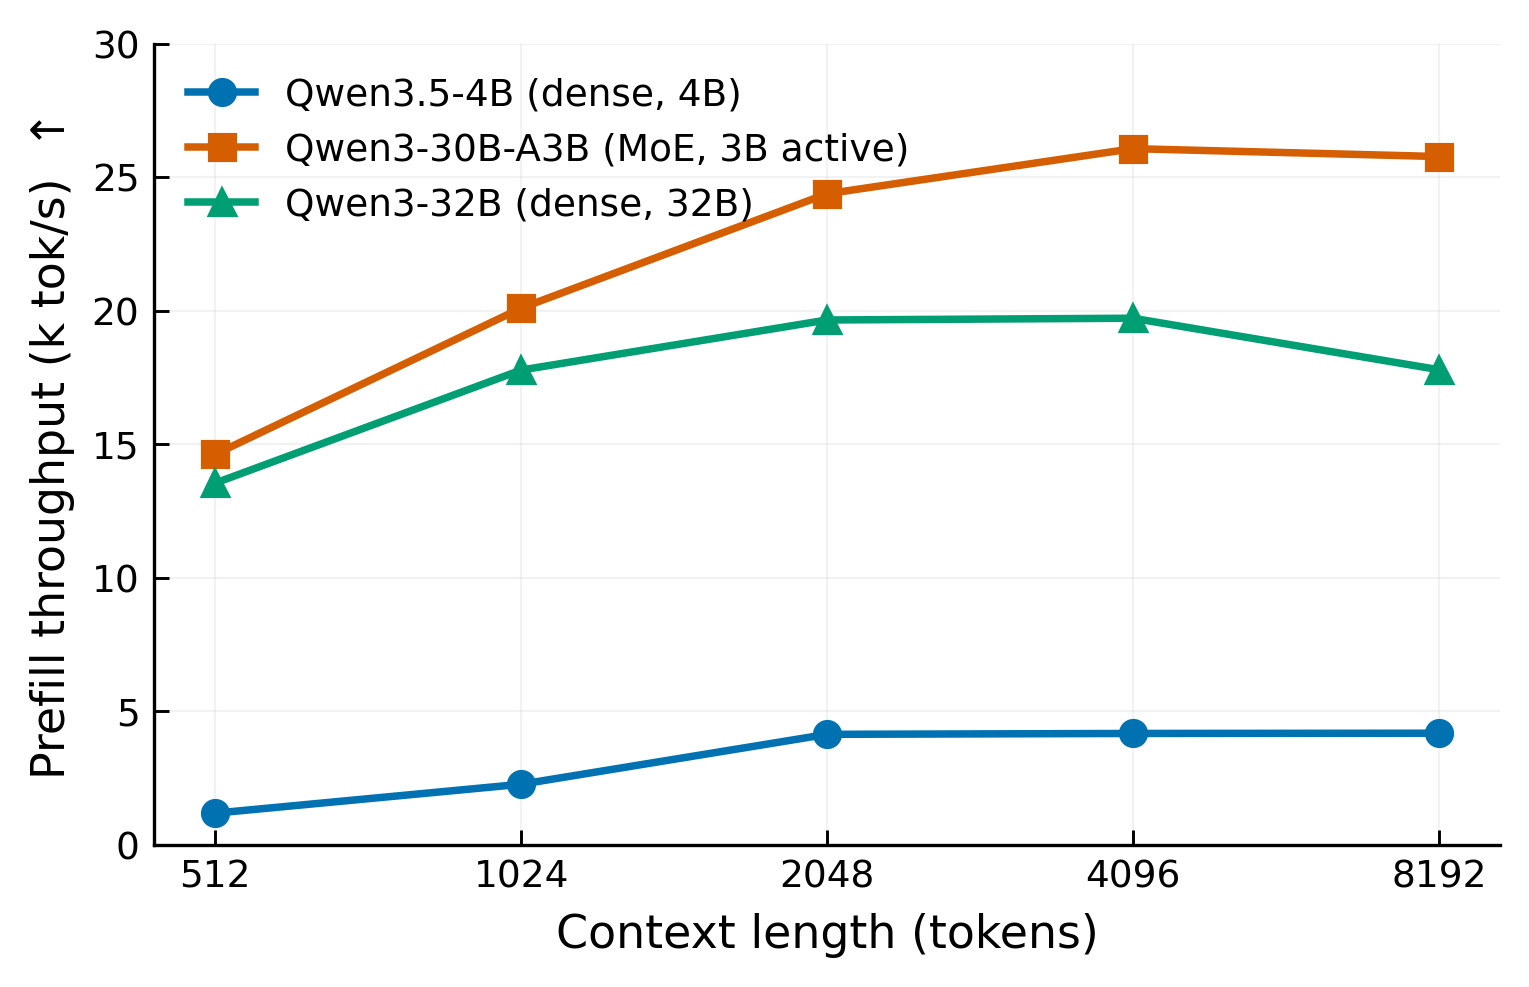
The MoE model has the highest prefill throughput.
| Model | Best prefill throughput | Per-chip peak |
|---|---|---|
| Qwen3-30B-A3B | 26,063 tok/s | ~6.5k tok/s |
| Qwen3-32B | 19,714 tok/s | ~4.9k tok/s |
| Qwen3.5-4B | 4,177 tok/s | ~4.2k tok/s |
| Model | ctx 512 | ctx 1024 | ctx 2048 | ctx 4096 | ctx 8192 |
|---|---|---|---|---|---|
| Qwen3-30B-A3B | 35 ms | 51 ms | 84 ms | 157 ms | 318 ms |
| Qwen3-32B | 38 ms | 58 ms | 104 ms | 208 ms | 461 ms |
| Qwen3.5-4B | 432 ms | 452 ms | 495 ms | 983 ms | 1,961 ms |
The 4B result is limited by its single-chip setup and by max-num-batched-tokens=2048. For contexts above 2048, prefill is split into chunks, so the curve flattens.
##
3.2 Decode
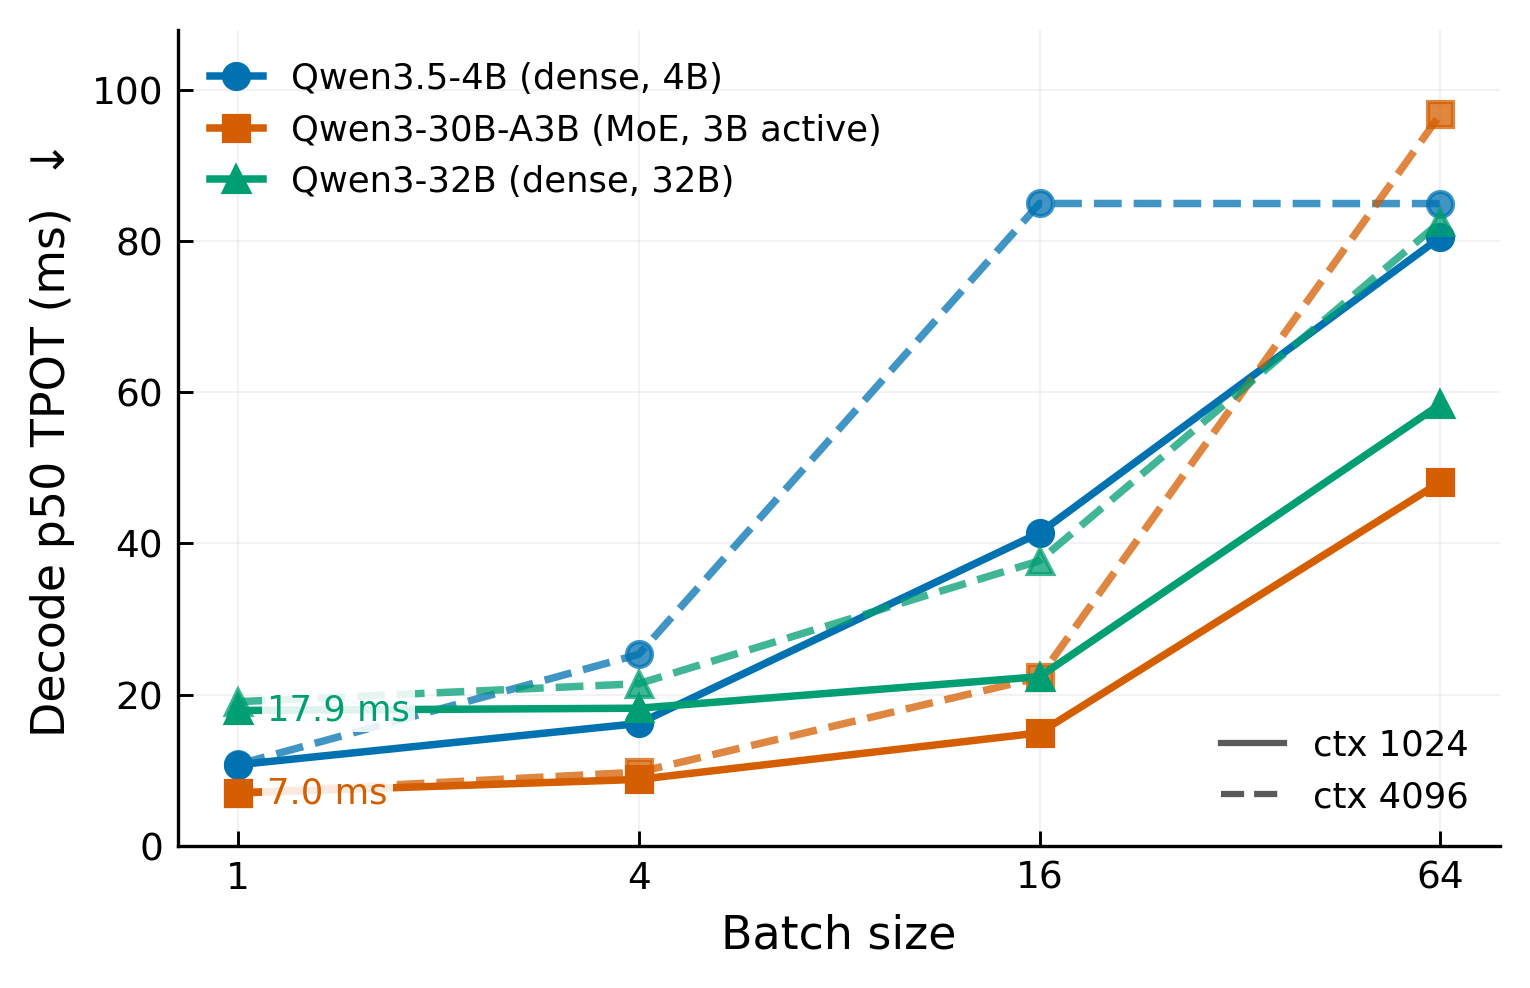
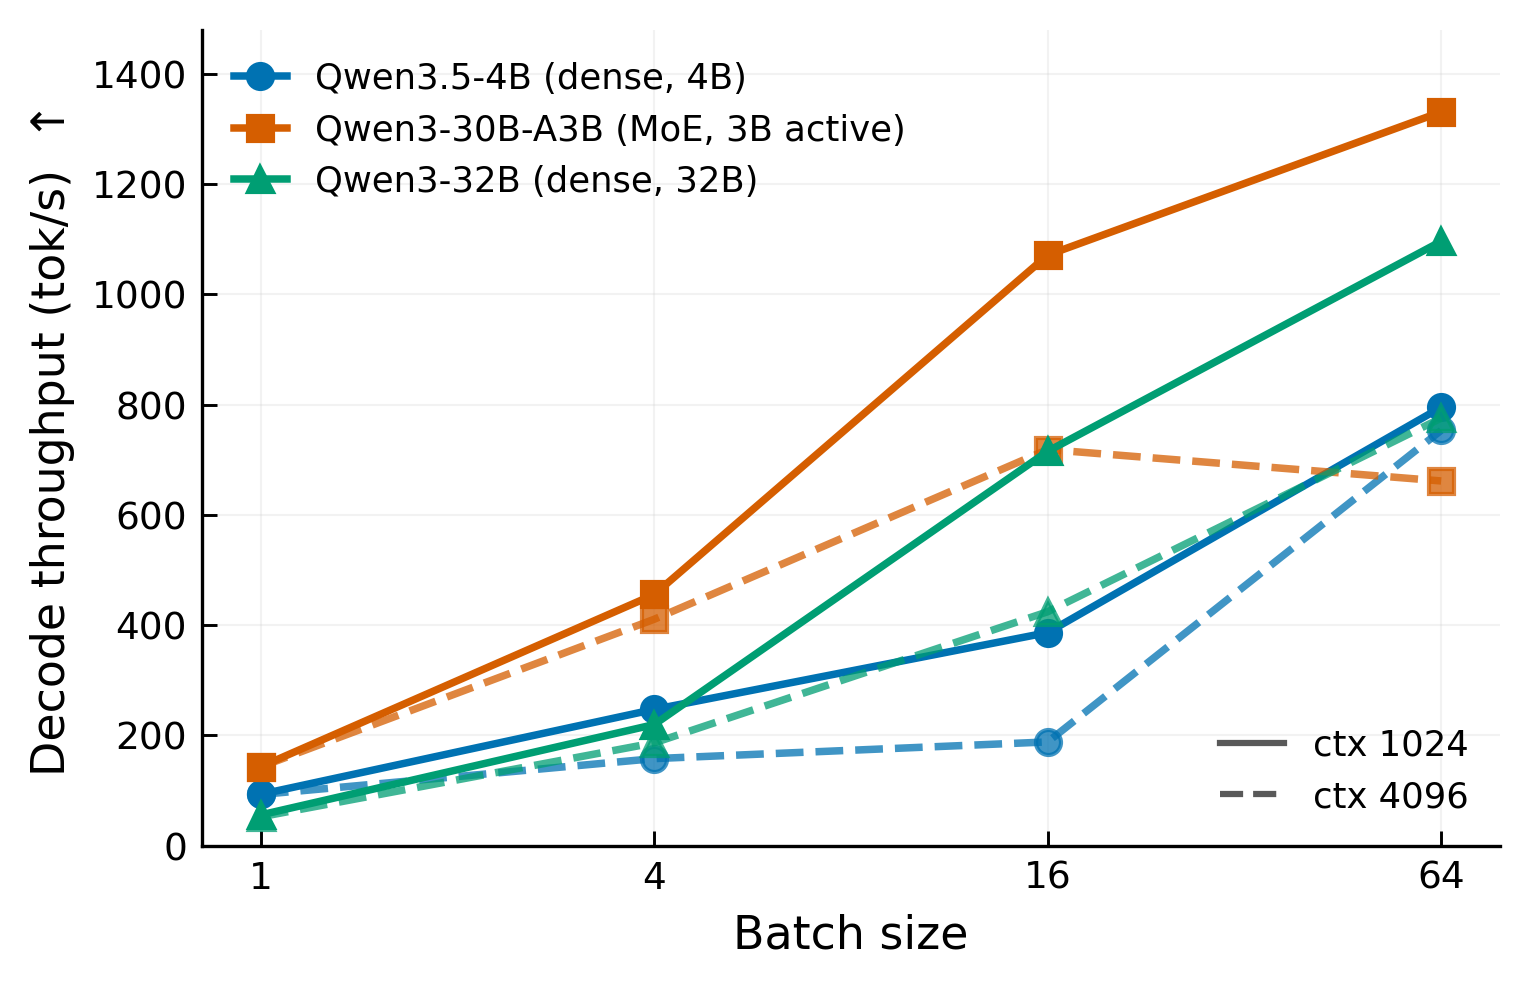
| Model | BS | p50 TPOT | p99 TPOT | throughput |
|---|---|---|---|---|
| Qwen3-30B-A3B | 1 | 7.0 ms | 7.1 ms | 143 tok/s |
| Qwen3-30B-A3B | 4 | 8.8 ms | 9.9 ms | 456 tok/s |
| Qwen3-30B-A3B | 16 | 14.9 ms | 17.5 ms | 1,071 tok/s |
| Qwen3-30B-A3B | 64 | 48.1 ms | 152.7 ms | 1,331 tok/s |
| Qwen3-32B | 1 | 17.9 ms | 17.9 ms | 56 tok/s |
| Qwen3-32B | 4 | 18.2 ms | 19.4 ms | 220 tok/s |
| Qwen3-32B | 16 | 22.4 ms | 27.4 ms | 715 tok/s |
| Qwen3-32B | 64 | 58.4 ms | 65.3 ms | 1,096 tok/s |
| Qwen3.5-4B | 1 | 10.7 ms | 10.7 ms | 93 tok/s |
| Qwen3.5-4B | 4 | 16.2 ms | 18.3 ms | 247 tok/s |
| Qwen3.5-4B | 16 | 41.4 ms | 647.3 ms | 387 tok/s |
| Qwen3.5-4B | 64 | 80.5 ms | 97.2 ms | 795 tok/s |
| Model | BS | p50 TPOT | p99 TPOT | throughput |
|---|---|---|---|---|
| Qwen3-30B-A3B | 1 | 7.0 ms | 7.1 ms | 143 tok/s |
| Qwen3-30B-A3B | 4 | 9.7 ms | 12.9 ms | 411 tok/s |
| Qwen3-30B-A3B | 16 | 22.3 ms | 28.5 ms | 719 tok/s |
| Qwen3-30B-A3B | 64 | 96.8 ms | 213.9 ms | 661 tok/s |
| Qwen3-32B | 1 | 19.1 ms | 19.3 ms | 53 tok/s |
| Qwen3-32B | 4 | 21.4 ms | 25.2 ms | 187 tok/s |
| Qwen3-32B | 16 | 37.7 ms | 130.6 ms | 424 tok/s |
| Qwen3-32B | 64 | 82.5 ms | 92.8 ms | 775 tok/s |
| Qwen3.5-4B | 1 | 10.8 ms | 10.8 ms | 93 tok/s |
| Qwen3.5-4B | 4 | 25.3 ms | 34.1 ms | 158 tok/s |
| Qwen3.5-4B | 16 | 85.0 ms | 89.2 ms | 188 tok/s |
| Qwen3.5-4B | 64 | 85.0 ms | 89.2 ms | 753 tok/s |
At batch size 1, the MoE model is 2.5× faster than the dense 32B model: 7.0 ms versus 17.9 ms at context 1024. This follows active parameter count. Decode is memory-bandwidth-bound. The MoE model reads 3B active parameters per token; the dense 32B model reads all 32B.
Tail latency — the p99 columns of Tables 4 and 5 — stays tight for the four-chip models until BS64 (the 30B-A3B reaches p99 152.7 ms against a 48.1 ms p50 at ctx 1024). The 4B model on one chip is the outlier: at BS16 ctx 1024 its p99 TPOT reaches 647.3 ms against a 41.4 ms p50. These decode runs are driven at an unlimited request rate, so on the single chip the prefill chunks of newly admitted requests repeatedly preempt in-flight decode — the median inter-token latency stays near 12 ms while a heavy minority of requests stall. This marks the 4B’s single-chip concurrency limit, not steady-state decode.
At context 4096, longer KV sequences reduce throughput across all models. The 30B-A3B at BS64 drops from 1,331 tok/s (ctx 1024) to 661 tok/s (ctx 4096). The dense 32B drops less in relative terms (1,096 to 775 tok/s) because its compute is already the bottleneck at ctx 1024. The 4B model saturates at BS16 for ctx 4096: p50 TPOT at BS64 equals BS16 (85.0 ms both), meaning additional concurrency gives no throughput gain on one chip.
##
3.3 Online serving
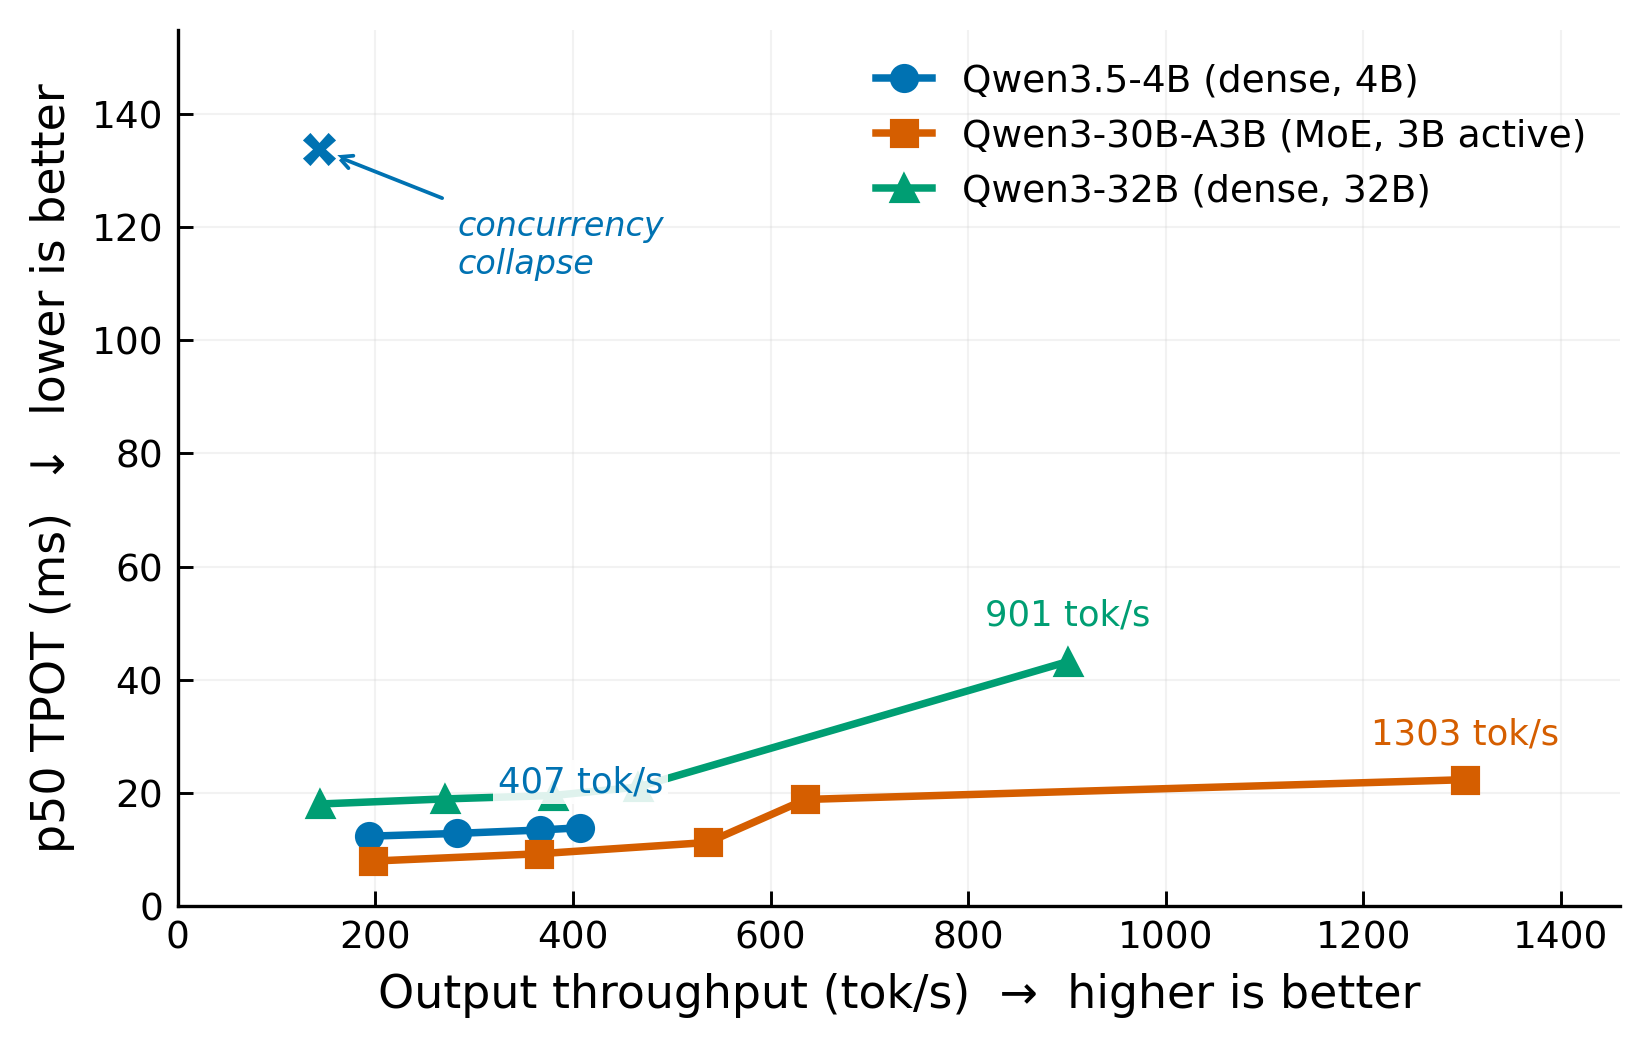
In online serving, higher request rate gives higher throughput, but also higher latency. Each model reaches a point where adding more requests no longer helps.
| Req rate | Actual req/s | Output tok/s | TTFT p50 | TTFT p99 | TPOT p50 | TPOT p99 | E2E p50 |
|---|---|---|---|---|---|---|---|
| 0.2 | 0.19 | 197 | 90 ms | 2,682 ms | 7.9 ms | 9.0 ms | 8.2 s |
| 0.4 | 0.36 | 366 | 92 ms | 190 ms | 9.2 ms | 10.1 ms | 9.5 s |
| 0.6 | 0.52 | 537 | 94 ms | 1,331 ms | 11.2 ms | 13.8 ms | 11.6 s |
| 0.8 | 0.62 | 635 | 116 ms | 6,335 ms | 18.8 ms | 28.7 ms | 24.6 s |
| ∞ | 1.27 | 1,303 | 712 ms | 1,092 ms | 22.3 ms | 22.8 ms | 23.6 s |
| Req rate | Actual req/s | Output tok/s | TTFT p50 | TTFT p99 | TPOT p50 | TPOT p99 | E2E p50 |
|---|---|---|---|---|---|---|---|
| 0.15 | 0.14 | 144 | 115 ms | 2,243 ms | 18.0 ms | 18.3 ms | 18.5 s |
| 0.3 | 0.26 | 271 | 115 ms | 1,042 ms | 18.9 ms | 20.1 ms | 19.5 s |
| 0.45 | 0.37 | 380 | 116 ms | 295 ms | 19.5 ms | 20.9 ms | 20.2 s |
| 0.6 | 0.45 | 466 | 123 ms | 3,983 ms | 21.0 ms | 28.1 ms | 21.7 s |
| ∞ | 0.88 | 901 | 1,190 ms | 9,249 ms | 43.2 ms | 44.0 ms | 45.4 s |
| Req rate | Actual req/s | Output tok/s | TTFT p50 | TTFT p99 | TPOT p50 | TPOT p99 | E2E p50 |
|---|---|---|---|---|---|---|---|
| 0.2 | 0.19 | 194 | 509 ms | 33,147 ms | 12.3 ms | 15.4 ms | 13.1 s |
| 0.3 | 0.28 | 283 | 507 ms | 1,185 ms | 12.8 ms | 14.3 ms | 13.7 s |
| 0.4 | 0.36 | 367 | 506 ms | 1,099 ms | 13.4 ms | 15.7 ms | 14.4 s |
| 0.45 | 0.40 | 407 | 507 ms | 1,141 ms | 13.8 ms | 15.9 ms | 14.6 s |
| ∞ | 0.14 | 143 | 6,762 ms | 219,855 ms | 133.8 ms | 237.2 ms | 206.8 s |
The MoE model (30B-A3B) has a stable working zone up to about 0.6 req/s, where p50 TPOT stays below 12 ms and p99 TTFT stays below 1.4 seconds. At 0.8 req/s the server is already queuing: p99 TTFT jumps to 6.3 seconds while p50 TPOT jumps from 11 ms to 19 ms. Saturation at ∞ rate gives tight p99/p50 TPOT (22.8 ms versus 22.3 ms), meaning the server is consistently loaded with no idle cycles.
The dense 32B model’s TPOT p50 is nearly flat from 0.15 to 0.6 req/s (18–21 ms), then doubles at saturation (43.2 ms). Its TTFT p99 is noisy across the sweep, suggesting occasional prefill bursts even at low load.
The 4B model holds stable from 0.2 to 0.45 req/s. At 0.45 req/s it sustains 0.40 req/s and 407 output tok/s, with TPOT p50 of 13.8 ms and E2E p50 of 14.6 seconds. Under unlimited load it collapses entirely: output throughput drops from 407 tok/s to 143 tok/s, p50 TPOT rises from 13.8 ms to 133.8 ms, and p50 E2E latency reaches 206.8 seconds. The p99 TTFT at unlimited load is 219,855 ms — 220 seconds. This is not a degraded state; it is a broken one. We treat the unlimited-load point as a single-chip concurrency limit, not useful serving capacity.
| Model | p50 TTFT | p50 E2E latency |
|---|---|---|
| Qwen3-30B-A3B | 712 ms | 23.6 s |
| Qwen3-32B | 1,190 ms | 45.4 s |
| Qwen3.5-4B | 507 ms | 14.6 s |
Across all three tests, the MoE model beats the dense 32B model at similar total parameter count:
| Metric | Qwen3-30B-A3B | Qwen3-32B |
|---|---|---|
| Best prefill throughput | 26,063 tok/s | 19,714 tok/s |
| BS1 decode TPOT | 7.0 ms | 17.9 ms |
| Serving capacity | 1.27 req/s | 0.88 req/s |
| Output throughput at saturation | 1,303 tok/s | 901 tok/s |
The MoE model gives about 2.5× lower single-stream decode latency, about 1.4× higher serving capacity, and about 1.3× higher prefill throughput.
#
4. Discussion
Three points stand out.
First, active parameter count matters a lot for decode. The 30B-A3B MoE and the 32B dense model have similar total size, but very different active size. The MoE model uses 3B parameters per token. The dense model uses 32B. This explains the large decode gap: 7.0 ms versus 17.9 ms at batch size 1.
Second, the MoE model also wins in prefill. Its peak prefill throughput is 26,063 tok/s, or about 6.5k tok/s per chip. The dense 32B model reaches 19,714 tok/s, or about 4.9k tok/s per chip. On this host, the MoE model is faster in both prefill and decode.
Third, the small 4B model is limited by single-chip concurrency. It has good low-load latency, but one chip cannot absorb unlimited requests. Its practical serving capacity is about 0.45 req/s. To serve more traffic, the better path is to add chips or replicas, rather than pushing more concurrency onto one chip.
#
5. Conclusion
On one TPU v6e-4 host, using vLLM 0.20.0, tpu-inference, and an fp8_e5m2 KV cache, the large MoE model is the fastest of the three models we tested.
Compared with the dense 32B model, Qwen3-30B-A3B has:
- higher prefill throughput: 26,063 vs 19,714 tok/s,
- lower batch-size-1 decode latency: 7.0 vs 17.9 ms,
- higher serving capacity: 1.27 vs 0.88 req/s,
- higher output throughput at saturation: 1,303 vs 901 tok/s.
The 4B dense model has good latency at low load, but on one chip it is concurrency-limited. Its stable serving capacity is about 0.45 req/s.
#
Limitations
These results are for one host only: four TPU v6e chips in one VM. We did not test multi-host scaling.
We did not run a GPU baseline, so this study makes no TPU-versus-GPU claim.
The online serving test uses one input/output shape: 1024 input tokens and 1024 output tokens. Other workloads may shift the balance between prefill and decode.
The results are version-specific. TPU support in vLLM changes quickly, so the numbers here apply to vLLM 0.20.0.
All runs use an fp8_e5m2 KV cache. We did not test other KV cache formats.
#
Reproducibility
The main numbers are ./data.json
Figures are generated by ./figures/plot.py
Per-model results are at ./rawdata.zip