Debunking introl and ainewshub: “TPU is 4x Cheaper than GPU” is an AI Hallucination
- EN
- ZH-CN
Table of Contents
Disclaimer: this article is not arguing that TPU is worse than GPU. TPU and GPU each have their own fit, and which one wins depends on the specific workload. My point is that the batch of comparison data currently circulating online is itself inaccurate, much of it AI-fabricated and impossible to trace. What I’m taking apart below is exactly that fake data.
Artificial Analysis recently released a set of hardware benchmarks1. Using Llama 3.3 70B, vLLM, and a reference speed of 30 output tokens/s per query to compute the cost per million input/output tokens, NVIDIA has roughly a 5x per-dollar token advantage over TPU v6e (Trillium), and roughly a 2x advantage over AMD MI300X2.
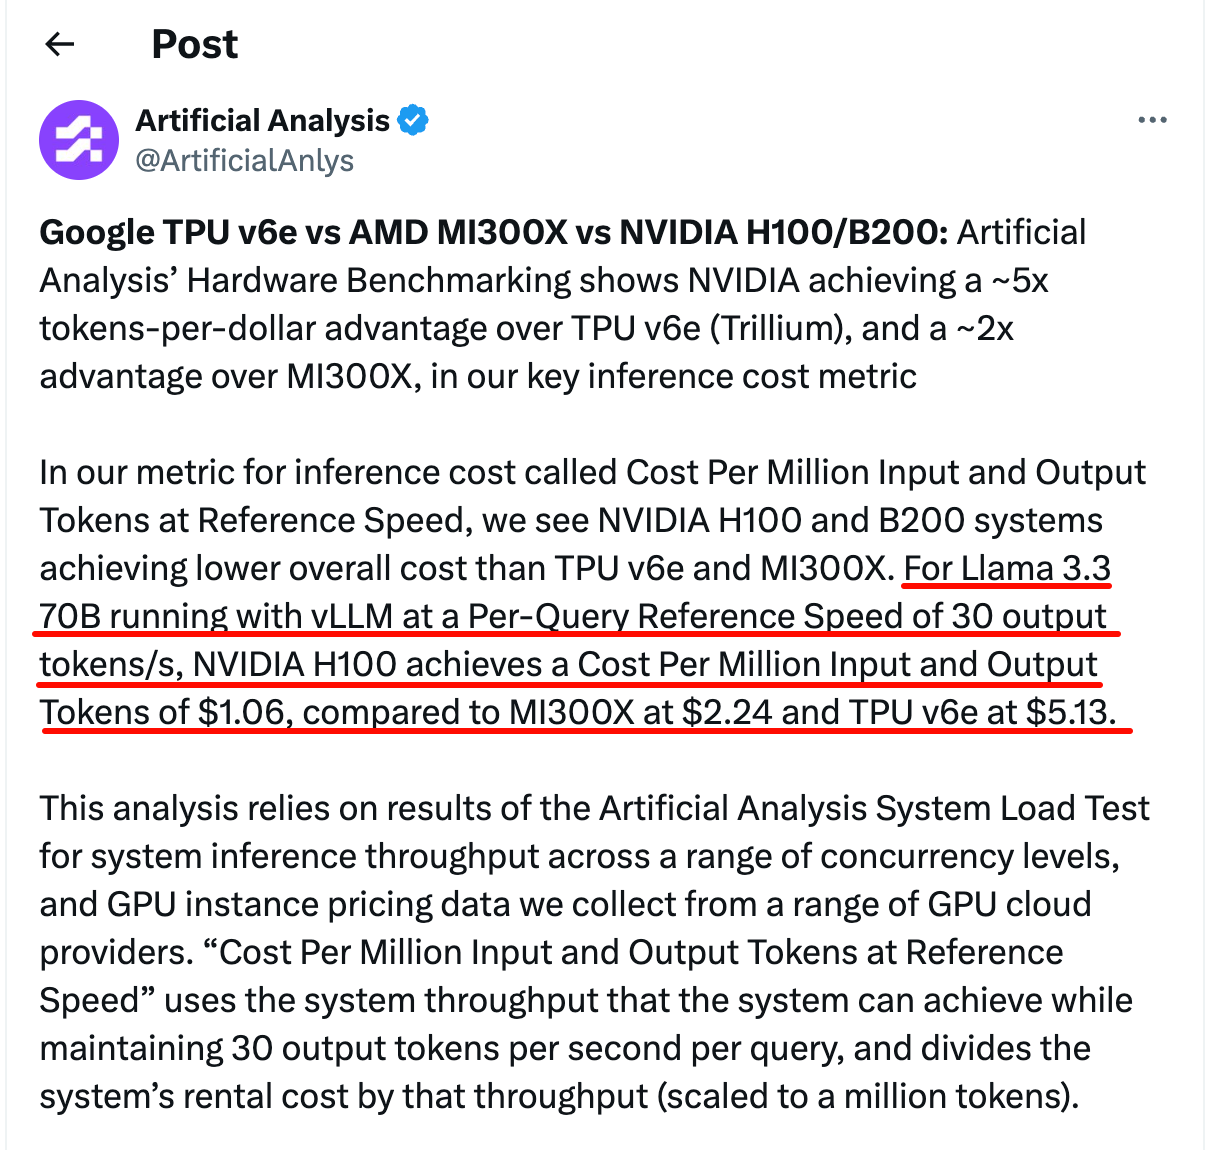
The hardware benchmark conclusion Artificial Analysis posted on X. NVIDIA has about a 5x per-dollar token advantage over TPU v6e and about 2x over MI300X. H100 is $1.06, MI300X is $2.24, TPU v6e is $5.13.
Alongside this reproducible data, another kind of thing is also circulating online.
#
A High-Profile Comparison Article
introl has an article titled Google TPU v6e vs GPU: 4x Better AI Performance Per Dollar3. Its core argument is that TPU has 4x better performance per dollar than H100, and that TPU completely beats NVIDIA on inference economics. Its key data comes from another article, ainewshub.org’s Nvidia vs Google TPU 2025 Cost Comparison4. Follow this citation chain down and you find that both are AI-generated, and the data is made up.
#
The First Problem: The Core Citation Points to Data That Doesn’t Exist
The most central sentence in the ainewshub article reads like this.
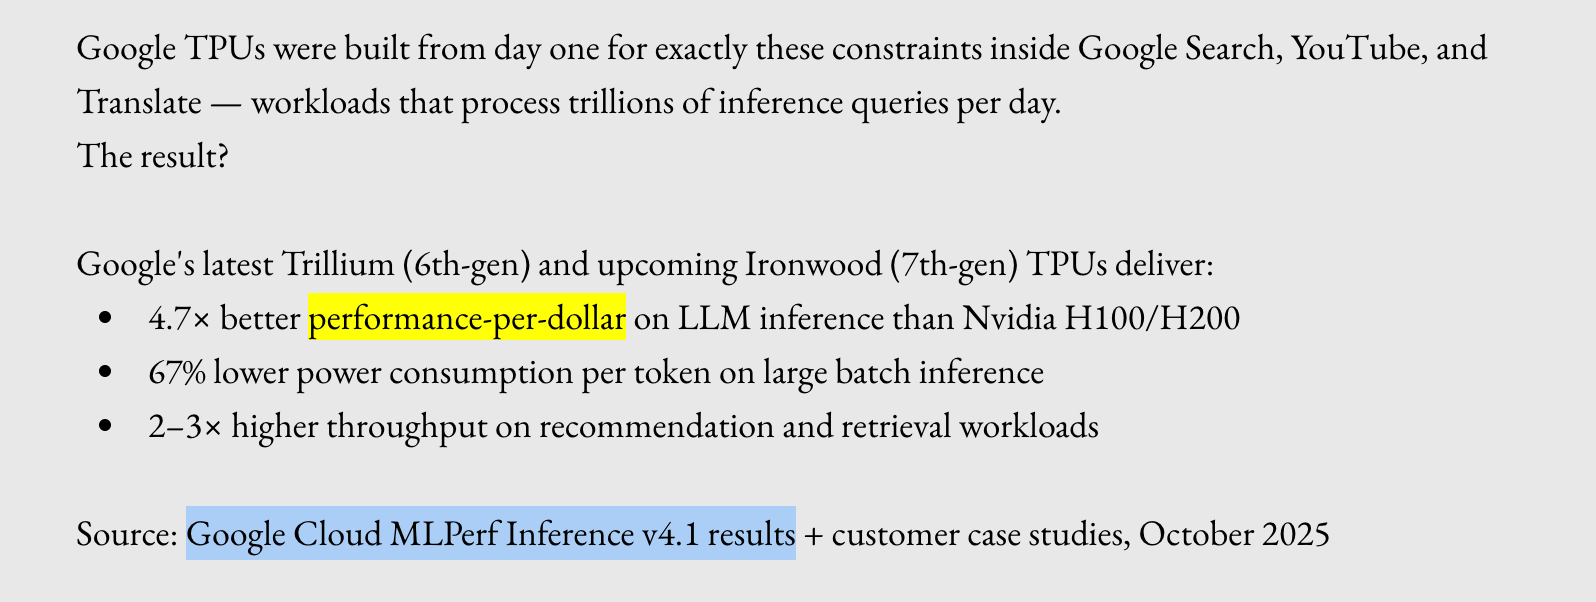
The core claim in the ainewshub article, 4.7x better performance per dollar, but the source it cites is a non-existent MLPerf v4.1 LLM inference result.
“4.7× better performance-per-dollar on LLM inference than Nvidia H100/H200”, with the source listed as Google Cloud MLPerf Inference v4.1 results + customer case studies, October 2025.
But in fact, in MLPerf Inference v4.1, Google’s TPU submissions include only one model, stable-diffusion-xl. I went to MLCommons’ official results5 and filtered by Google plus TPU. Under v4.1 Closed Datacenter there are only two records, tpu-v5e-4 and tpu-v6-4, and both ran stable-diffusion-xl.
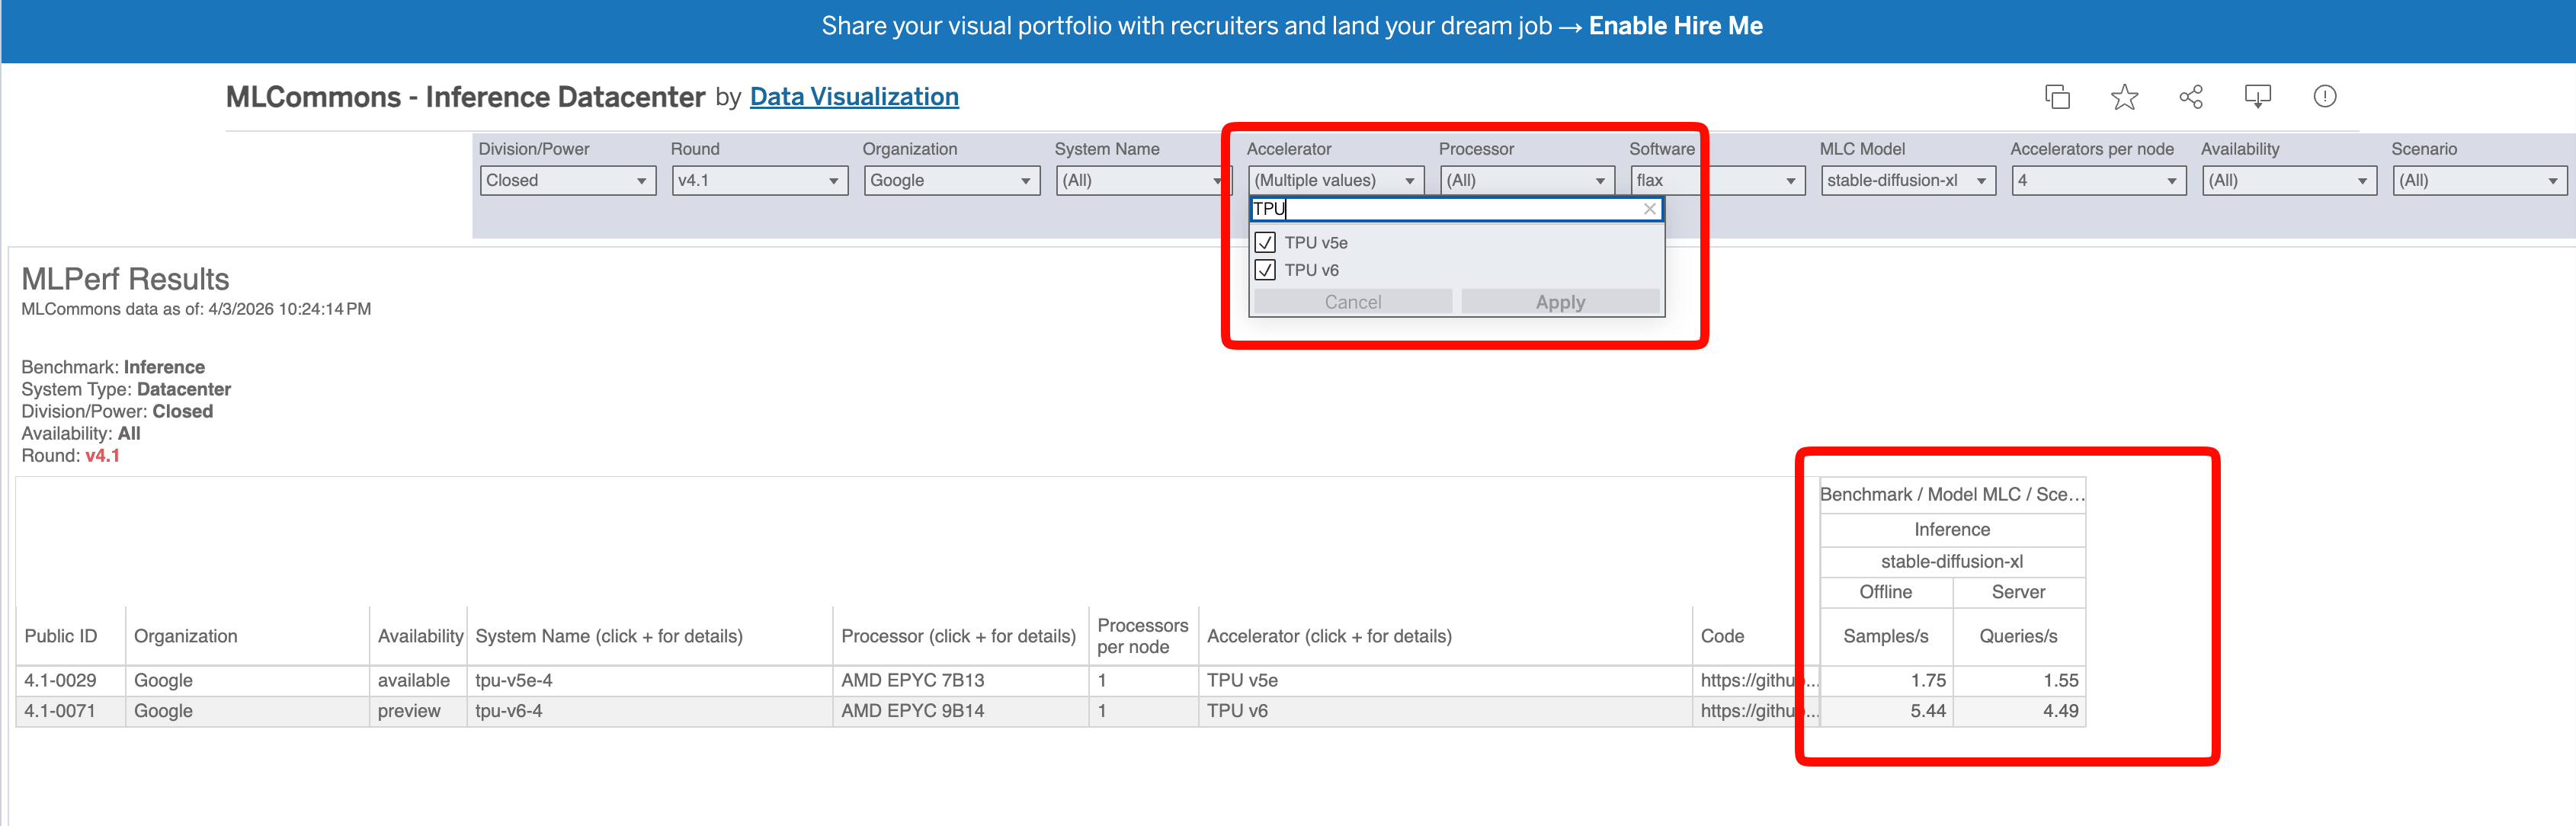
Filtering MLPerf v4.1 Closed Datacenter for Google TPU shows only two entries, tpu-v5e-4 and tpu-v6-4, both running stable-diffusion-xl. There is no LLM inference entry at all.
No LLM inference entry at all! The so-called MLPerf v4.1 LLM inference 4.7x performance per dollar cited by this article simply does not exist in the source it claims. The number was generated out of thin air and then attached to an authoritative-looking source.
Second, MLPerf does not report performance per dollar at all. It reports throughput, samples/s and queries/s, with no pricing in it. So that 4.7x could not possibly have been computed from MLPerf.
#
The Second Problem: The Numbers Drift Between Reposts
Put introl3 and ainewshub4 side by side and the numbers don’t match (and there are false statements).
- Performance per dollar multiple: introl writes 4x, ainewshub writes 4.7x. (This one is pure deception, see above.)
- MLPerf version: introl cites v3.1, ainewshub cites v4.1. (No idea where introl got its data.)
- Midjourney case: introl writes monthly spend dropped from $2 million to $700k, ainewshub writes from $2.1 million to $700k. (I didn’t carefully verify this one, but it’s most likely hallucinated too.)
Reposted again and again, it changes a little each time it’s retold. Damn it, every time the model generates it, it makes up a slightly different number.
#
The Third Problem: A Frighteningly Precise TCO Table, With No Source
ainewshub4 gives a three-year total cost of ownership table, for a 1000-chip cluster, with NVIDIA H100 total cost $177 million, Google TPU v6 total cost $78.5 million, saving $98.5 million. It even breaks it down to hardware down 48%, power down 66%, cooling down 67%, support down 63%, networking down 67%, real estate down 63%. (All made up.)
This kind of breakdown precise to the single percentage point looks very professional. The problem is that not one item can be traced to a source. The accompanying customer cases are the same. Midjourney, and a so-called Series C computer vision startup whose monthly spend dropped from $340k to $89k, are all unverifiable specific numbers.
#
The Most Infuriating Part is “data verified”
Following the ainewshub cost comparison article further upstream, its source points to another article on the same site, AI Inference Costs: TPU vs GPU 20256. The same numbers are repeated here again, 4x value for money, Midjourney saving 65%, TPU v5e winning 8 out of 9 items. I have to stress again, this data is fake, it does not exist.
The statement at the end reads like this.
Data verified as of November 26, 2025. Sources include Google Cloud documentation, MLPerf benchmarks, company earnings reports, and verified industry migrations.
Verified? Nothing here was verified.
It says it verified, yet it can’t provide a single clickable link, no specific report, no methodology. As checked above, the MLPerf TPU LLM inference results it relies on simply do not exist. The so-called verified is all completely fake.
Different articles on the same site can’t even keep these fake numbers consistent. The person who wrote them doesn’t know where the numbers came from either, because they never existed in the first place.
A site that mass-produces hallucinated numbers and then stamps them all with data verified … this garbage site does real damage.
#
The Data I’ve Found So Far (At Least a Bit More Credible Than Their Site)
Artificial Analysis’ System Load Test1, running Llama 3.3 70B.
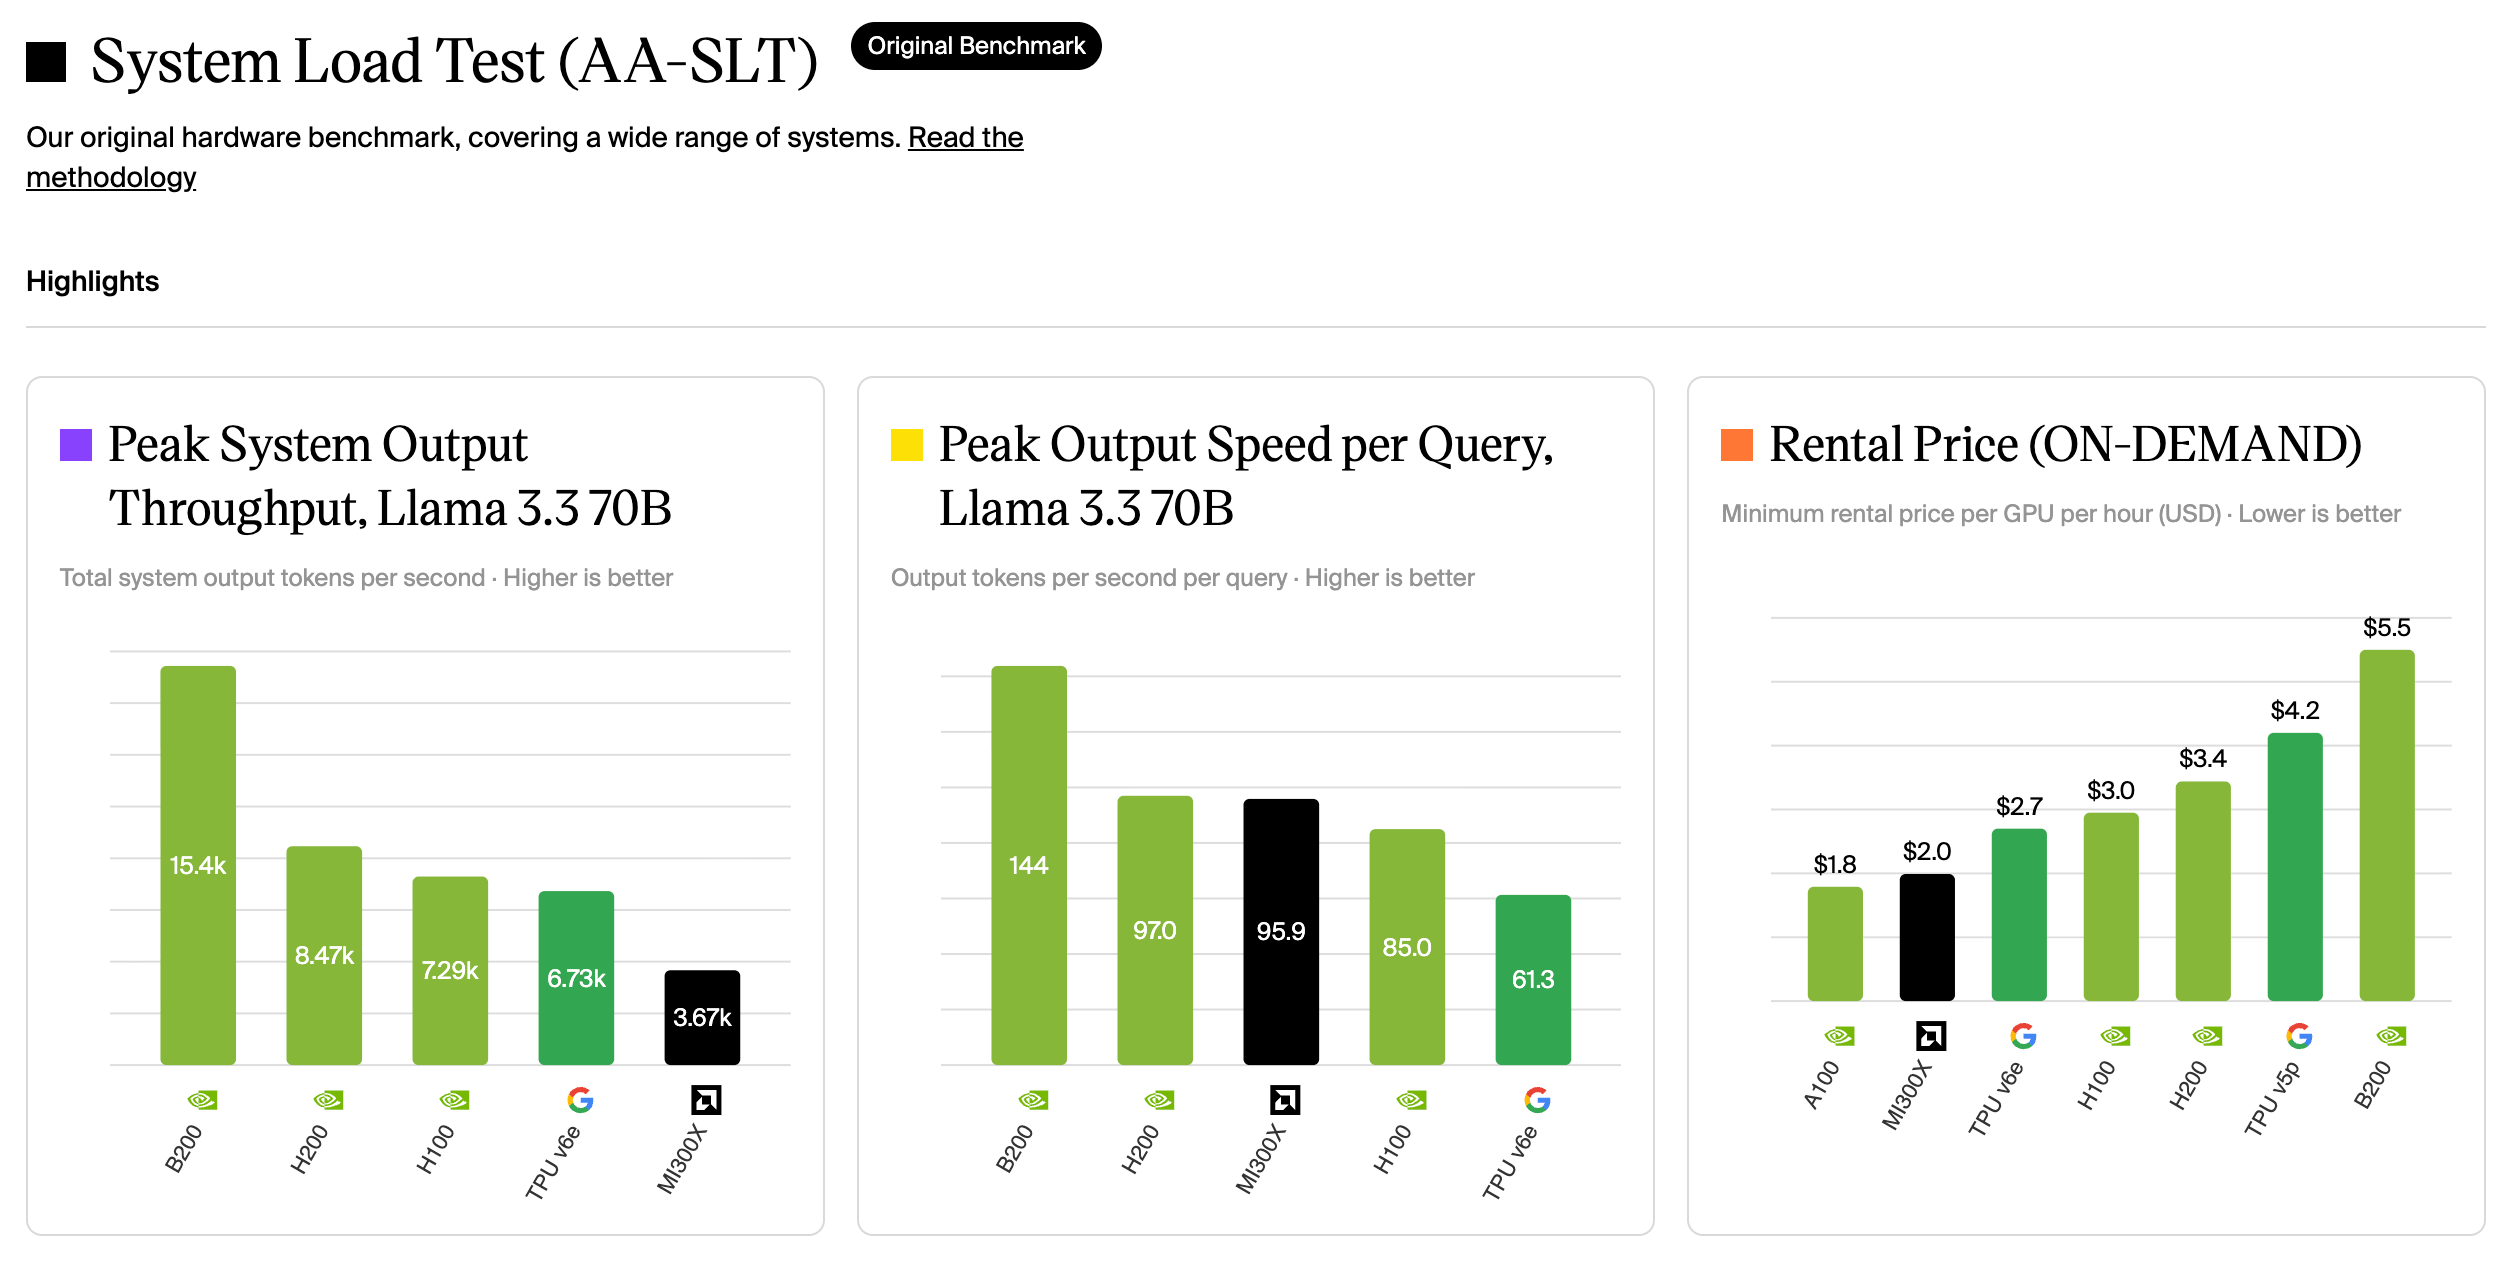
Artificial Analysis System Load Test, peak system throughput, per-query output speed, and on-demand rental price for Llama 3.3 70B.
Peak system throughput: B200 is 15.4k tokens/s, H200 is 8.47k, H100 is 7.28k, TPU v6e is 6.73k, MI300X is 3.67k. TPU v6e falls behind NVIDIA’s same generation. Per-query output speed, TPU v6e is 61.3 tokens/s, the slowest in this group.
Cost has to be discussed in two cases, and here TPU does have a favorable scenario too.
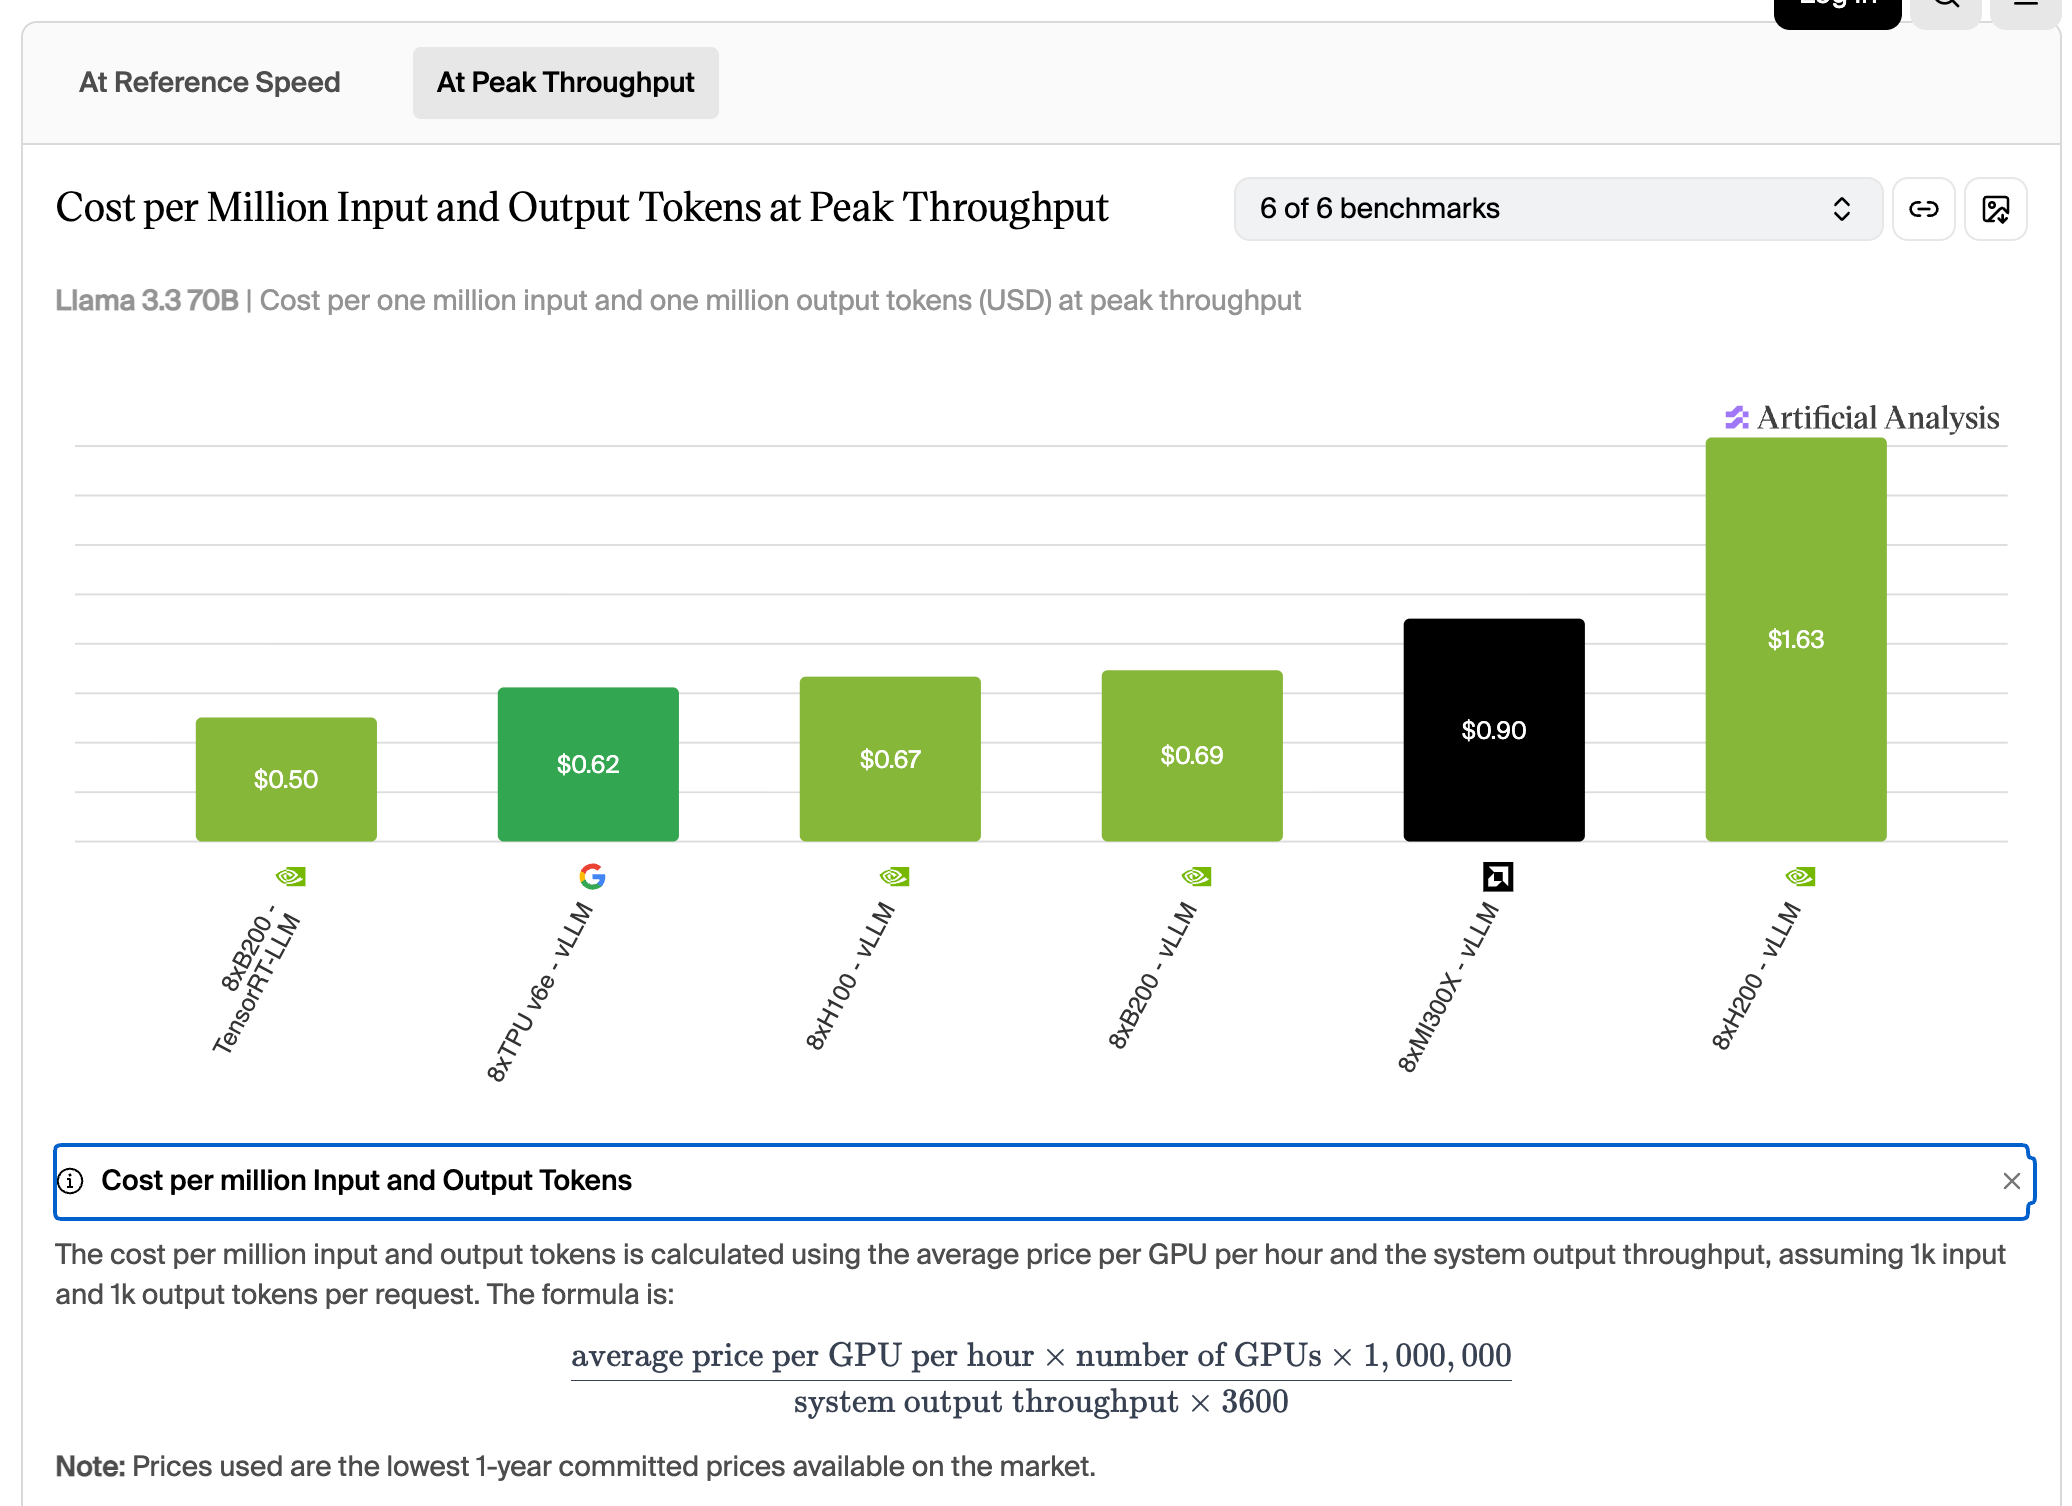
Cost per million tokens for Llama 3.3 70B at peak throughput. TPU v6e is $0.62, close to H100’s $0.67 to $0.69.
Computing cost per million tokens at peak throughput, TPU v6e is $0.62, close to H100’s $0.67 to $0.69, and cheaper than MI300X’s $0.90 and B200 running vLLM at $1.63. If the workload is offline large-batch and can keep the chips fed, TPU’s economics work out.
But online serving rarely runs at peak throughput. Once you require a usable interactive speed, for example the reference speed of 30 tokens/s per query, TPU v6e’s unit cost jumps to $5.13, while H100 is $1.06. This is where the roughly 5x gap Artificial Analysis mentions comes from.
Later we’ll run the benchmark ourselves to get first-hand data, and compare then.
#
How to Spot AI-Generated Junk Articles
Just follow one principle: any data, any number, must have a clickable source and a reproducible method.